Phylogeny:
Phylogeny is used to compare different species, organisms, or genes as they evolve over time. The most common way of doing this is comparing the genetic material (DNA/mRNA/Protein sequences) of the species/organisms/genes in question. Based on the differences found, a phylogenic tree can be constructed to illustrated the evolutionary relationship found and can help us understand what type of evolutionary mechanisms occurred over time. There are a variety of programs that are available, some of which can be found here, when trying to construct a tree. Note there is not a single perfect program and that different programs use different algorithms when constructing phylogenic trees. That is why it is important to use and compare multiple programs when trying to construct a phylogenic tree.
Protein phylogeny uses a protein sequence of interest (such as ATM) and subjects it to an alignment program such as BLAST (Basic Local Alignment Search Tool) which then compares the sequence to other known sequences (details on this program are given in [1]).By using this tool one is able to compare their protein of interest to other known protein sequences present in other organisms and see how related those various organisms are to the one which the protein of interest is from, which in this case would be humans. Here the ATM protein sequence from humans was aligned to other known ATM sequences of common model organisms (the details of their protein sequences can be found on the homology page) and the following trees were constructed illustrating the relatedness between these organisms and humans.
Protein phylogeny uses a protein sequence of interest (such as ATM) and subjects it to an alignment program such as BLAST (Basic Local Alignment Search Tool) which then compares the sequence to other known sequences (details on this program are given in [1]).By using this tool one is able to compare their protein of interest to other known protein sequences present in other organisms and see how related those various organisms are to the one which the protein of interest is from, which in this case would be humans. Here the ATM protein sequence from humans was aligned to other known ATM sequences of common model organisms (the details of their protein sequences can be found on the homology page) and the following trees were constructed illustrating the relatedness between these organisms and humans.
ClustalW2:
The two phylogenic trees bellow were constructed by aligning the protein sequences of the organisms in the ClustalW2 program on the default settings. If you would like to learn more about this program, click here for a tutorial on how it works [2].
When building the trees bellow two different methods were used. The average distance tree (figure 1) is built by aligning the sequences beforehand and then the program looks at the amount of identity, or the amount of sequence that is the same, between them. On the other hand, the tree built using the neighbor joining method (figure 2) uses a different algorithm that starts with a tree with one node and works by grouping the sequences with the least amount of distance between them and joins them at a node. The resulting tree is one that does not have even branch lengths, which is unique to this method. The reason for this is because the neighbor joining method does not assume a constant rate of mutation though out evolution. This is an important, distinguishing, feature of the neighbor joining method and is why it is a widely used method [3,4].
When building the trees bellow two different methods were used. The average distance tree (figure 1) is built by aligning the sequences beforehand and then the program looks at the amount of identity, or the amount of sequence that is the same, between them. On the other hand, the tree built using the neighbor joining method (figure 2) uses a different algorithm that starts with a tree with one node and works by grouping the sequences with the least amount of distance between them and joins them at a node. The resulting tree is one that does not have even branch lengths, which is unique to this method. The reason for this is because the neighbor joining method does not assume a constant rate of mutation though out evolution. This is an important, distinguishing, feature of the neighbor joining method and is why it is a widely used method [3,4].
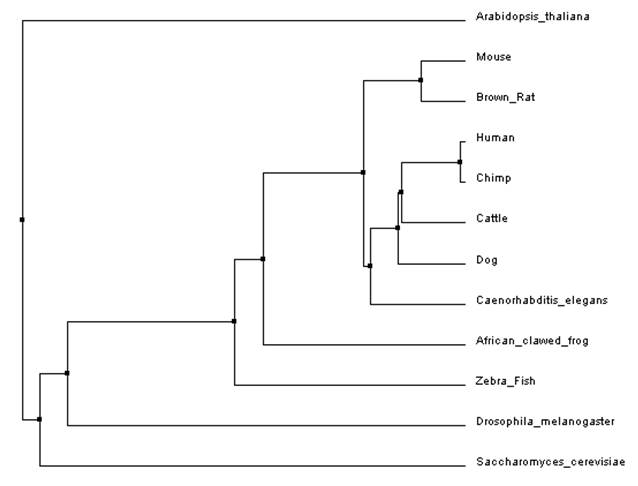
Figure 1: Average Distance using Percent Identity
|
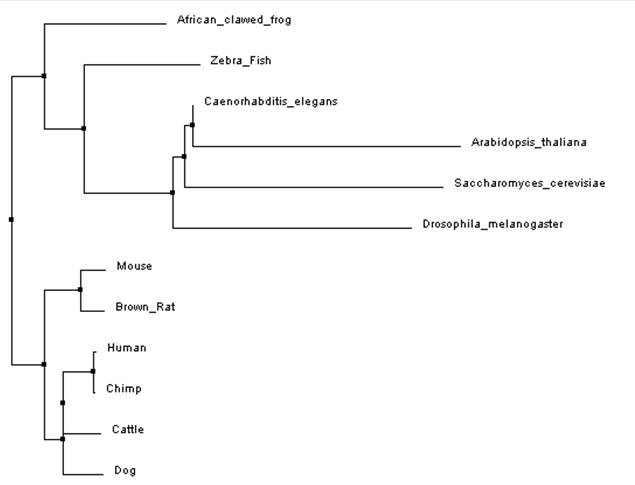
Figure 2: Neighbor Joining Method
|
Clustal Omega:
These trees were made using the clustal omega alignment program on default settings [5,6]. The tree in figure 3 is an average distance tree using percent identity while the tree in figure 4 used the neighbor joining method.
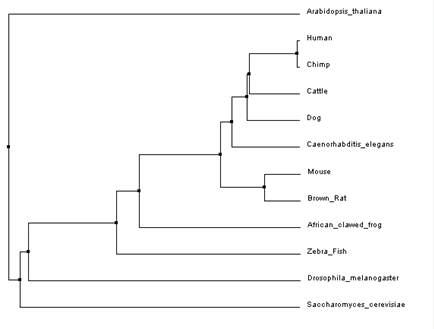
Figure 3: Average Distance using Percent Identity
|
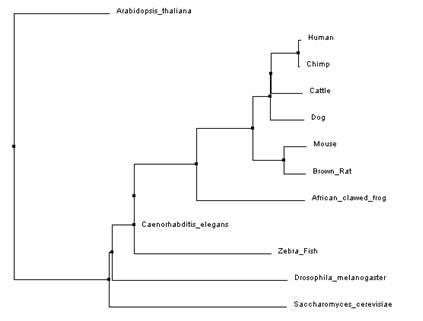
Figure 4: Neighbor Joining Method
|
Discussion (Model Organism Trees)
Overall, both programs showed that Arabidopsis thaliana and Saccharomyces cerevisiae (yeast) were the most distant when compared to the other model organisms. This is easily explained as Arabidopsis is a part of the Plantae kingdom and yeast is a part of the Fungi kingdom both which split off from the Animalia kingdom relatively early in evolution. Both programs produced a slightly different neighbor joining tree as compared to the average distance tree constructed using the same alignment. This could be due to the fact that the neighbor joining tree algorithm allows for different rates of evolution in different branches of the tree. This method also used a different distance algorithm which can also account for the different trees [3]. When comparing trees from the different programs the average distance trees (figure 1 and figure 3) were identical (even though it might look like it at first glance) but the neighbor joining (figure 2 and figure 4) trees showed a little variance. As mentioned earlier, different alignment programs use different algorithms so it is likely that is why there are differences between the two trees. This is why it is important to use multiple programs when constructing phylogenic trees.
MUSCLE Alignment
This tree includes the model organisms used from the previous trees as well as others with an ATM homolog. This is an average distance tree using percent identity and the protein sequences were aligned using MUSCLE [7,8]. If you would like, you can click on the tree in order to download a larger version of the tree.
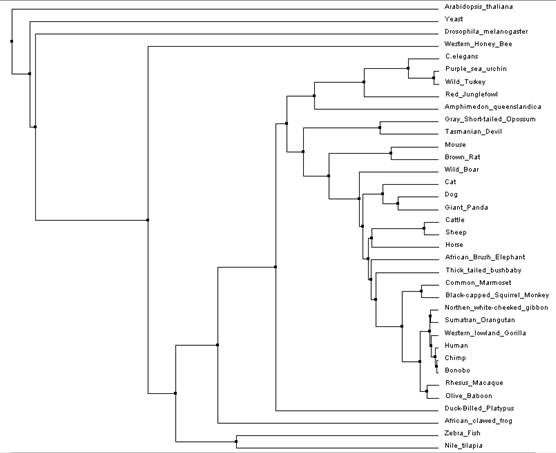
Figure 5: MUSCLE tree created by aligning ATM sequence of a wide variety of organisms
Discussion (MUSCLE tree):
This tree gave similar results as the model organism tree in that it showed that Arabidopsis and yeast were the most distantly related while humans and chimps are more closely related. Other organisms such as the honey bee and fruit fly were also shown to be a considerable distance away with respect to the rest of the tree. One surprising result was that this tree shows wild turkeys more closely related to purple sea urchins then they are with the red junglefowl. It was expect that this tree would show the turkey and junglefowl being more closely related as they are a part of the same family while the turkey does not even share the same phylum as the sea urchin, but this appears not to be the case when considering the evolution of the ATM protein in these organisms. It would be interesting to see how this tree would look when using proteins ATM is known to interact with. That can be something that could be done in the future in order to see if the wild turkey/sea urchin result is repeated.
References:
1. Dereeper A., Audic S., Claverie J., Blanc G. BLAST-EXPLORER helps you building datasets for phylogenetic analysis. BMC Evol Biol. 2010 Jan 12;10:8. PMID:20067610
2. http://www.ebi.ac.uk/Tools/msa/clustalw2 (ClustalW2 alignment page)
3. Barton, N. H., Briggs, D. E., Goldstein, D. B., & Patel, N. H. (2007-2010). Evolution (Ch.27-Box27.3). Cold Spring Harbor: Cold Spring Harbor Laoratory Press. Retrieved from: http://evolution-textbook.org/content/free/contents/ch27.html#ch27-4-2
4. Saitou, N., & Nei, M. (1984). The Neighbor-joining Method: A New method for Reconstructing Phylogenic Trees. Molecular Biology and Evolution, 4(4), 406-425. Retrieved from http://mbe.oxfordjournals.org/content/4/4/406.long
5. Sievers et. al. (2011). Fast, scalable generation of high-quality protein multiple sequence alignments using Clustal Omega. Molecular Systems Biology, 7(539). doi:10.1038/msb.2011.75
6. http://www.ebi.ac.uk/Tools/msa/clustalo/ (Clustal Omega alignment program)
7. Edgar, R. (2004). MUSCLE: multiple sequence alignment with high accuracy and high throughput. Nucleic Acids Research, 32(5), 1792-1797. doi:10.1093/nar/gkh340
8. http://www.ebi.ac.uk/Tools/msa/muscle/ (MUSCLE alignment program)
This web page was produced as an assignment for Genetics 677, an undergraduate course at UW-Madison
