MIcroarray:
Microarrays are important when studying certain genes because they measure the transcript levels of various genes in the cell at a certain time point. Seeing as transcripts are used to synthesize protein, measuring their levels is important because it alludes to the expression level of the gene from which they came from. For example, one can study the expression levels of a gene between a wild type cell and a diseased cell using a microarray and see if the levels differ between the two. By doing this, it can be studied how the expression level of a certain gene is connected to a disease. An example of a microarray can be seen in figure 1.
In order to search for microarrays done studying CLL and ATM, Gene Expression Omnibus (GEO) was used. This site provided a variety of different experiments where ATM levels were measured in CLL cells but these experiments were not helpful for this project. None of the studies found specifically studied ATM levels in 11q- patients, whom which this project was focused on. These data also do not take into account the mutation status of the ATM, which is important when determining prognosis of the patient [1]. If you wish to look further into these microarray experiments visit the GEO page and type in CLL and ATM in the box that says Gene profiles.
In order to search for microarrays done studying CLL and ATM, Gene Expression Omnibus (GEO) was used. This site provided a variety of different experiments where ATM levels were measured in CLL cells but these experiments were not helpful for this project. None of the studies found specifically studied ATM levels in 11q- patients, whom which this project was focused on. These data also do not take into account the mutation status of the ATM, which is important when determining prognosis of the patient [1]. If you wish to look further into these microarray experiments visit the GEO page and type in CLL and ATM in the box that says Gene profiles.
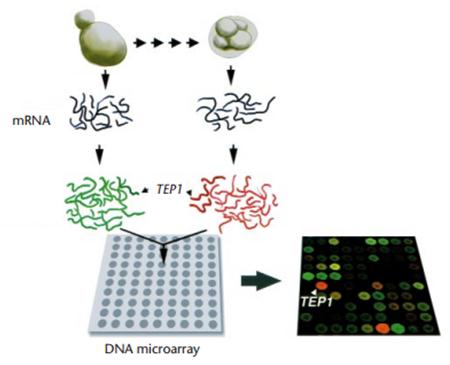
Figure 1: Example microarray: Transcripts (mRNA) are extracted from yeast cells in two different states. One transcript is florescently labeled green while the other is given a red florescent marker and they are then put on a DNA microarray chip (shown in gray chip, bottom left), Each dot represents a different gene. Based on the different intensities of the two colors (black chip, bottom right) the level of the various transcripts can be measured. The yellow color indicates the transcripts are present in both yeast cells. The TEP1 is just the example gene shown in this figure. [2].
References:
1. Austen, B., Skowronska, A., Baker, C., Powell, J. E., Gardiner, A., Oscier, D., . . . Stankovic, T. (2007). Mutation Status of the Residual ATM Allele Is an Important Determinant of the Cellular Response to Chemotherapy and Survival in Patients With Chronic Lymphocytic Leukemia Containing an 11q Deletion. Journal of Clincial Oncology, 25(34), 5448-5457. doi:10.1200/JCO.2007.11.2649
2. Brown, P. O., & Botstein, D. (1999). Exploring the new world of the genome with DNA microarray. Nature Genetics, 21, 33-37. doi:10.1038/4462
2. Brown, P. O., & Botstein, D. (1999). Exploring the new world of the genome with DNA microarray. Nature Genetics, 21, 33-37. doi:10.1038/4462
This web page was produced as an assignment for Genetics 677, an undergraduate course at UW-Madison
